PP scoring is on the rise. Which teams have the PK to stop it?
When two evenly matched teams meet, special teams is often the differentiator. No reason to think the NHL referees won't continue calling the slash/hooks on the hands this season. If so, a team's PK has the power to sway the fate of a game – and maybe the season
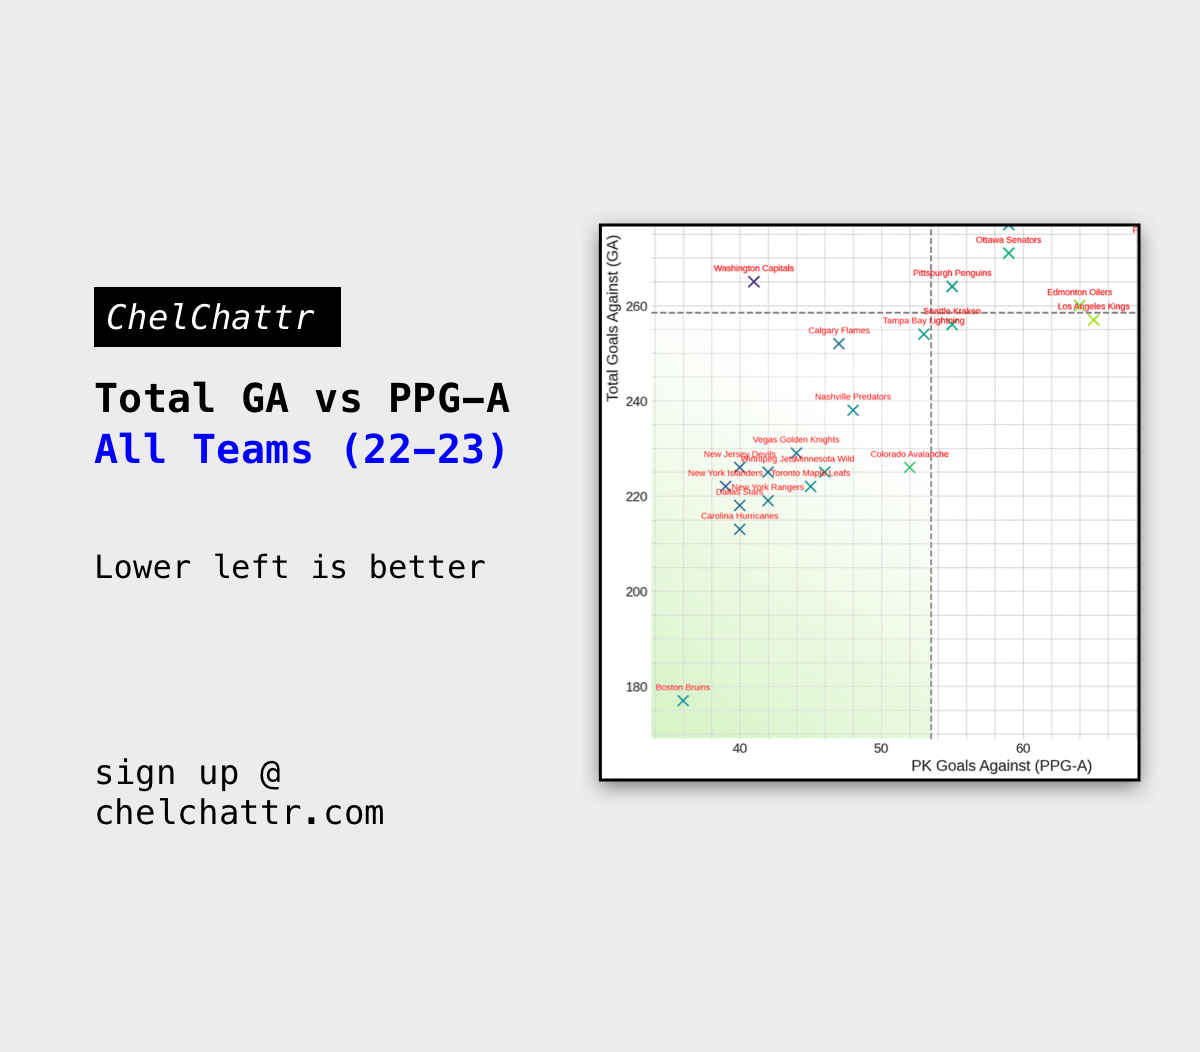
When two evenly matched teams meet, special teams is often the differentiator.
No reason to think the NHL referees won't continue calling the slash/hooks on the hands this season. If so, a team's PK has the power to sway the fate of a game – and sometimes a season. Which teams get it done on the PK?
charts
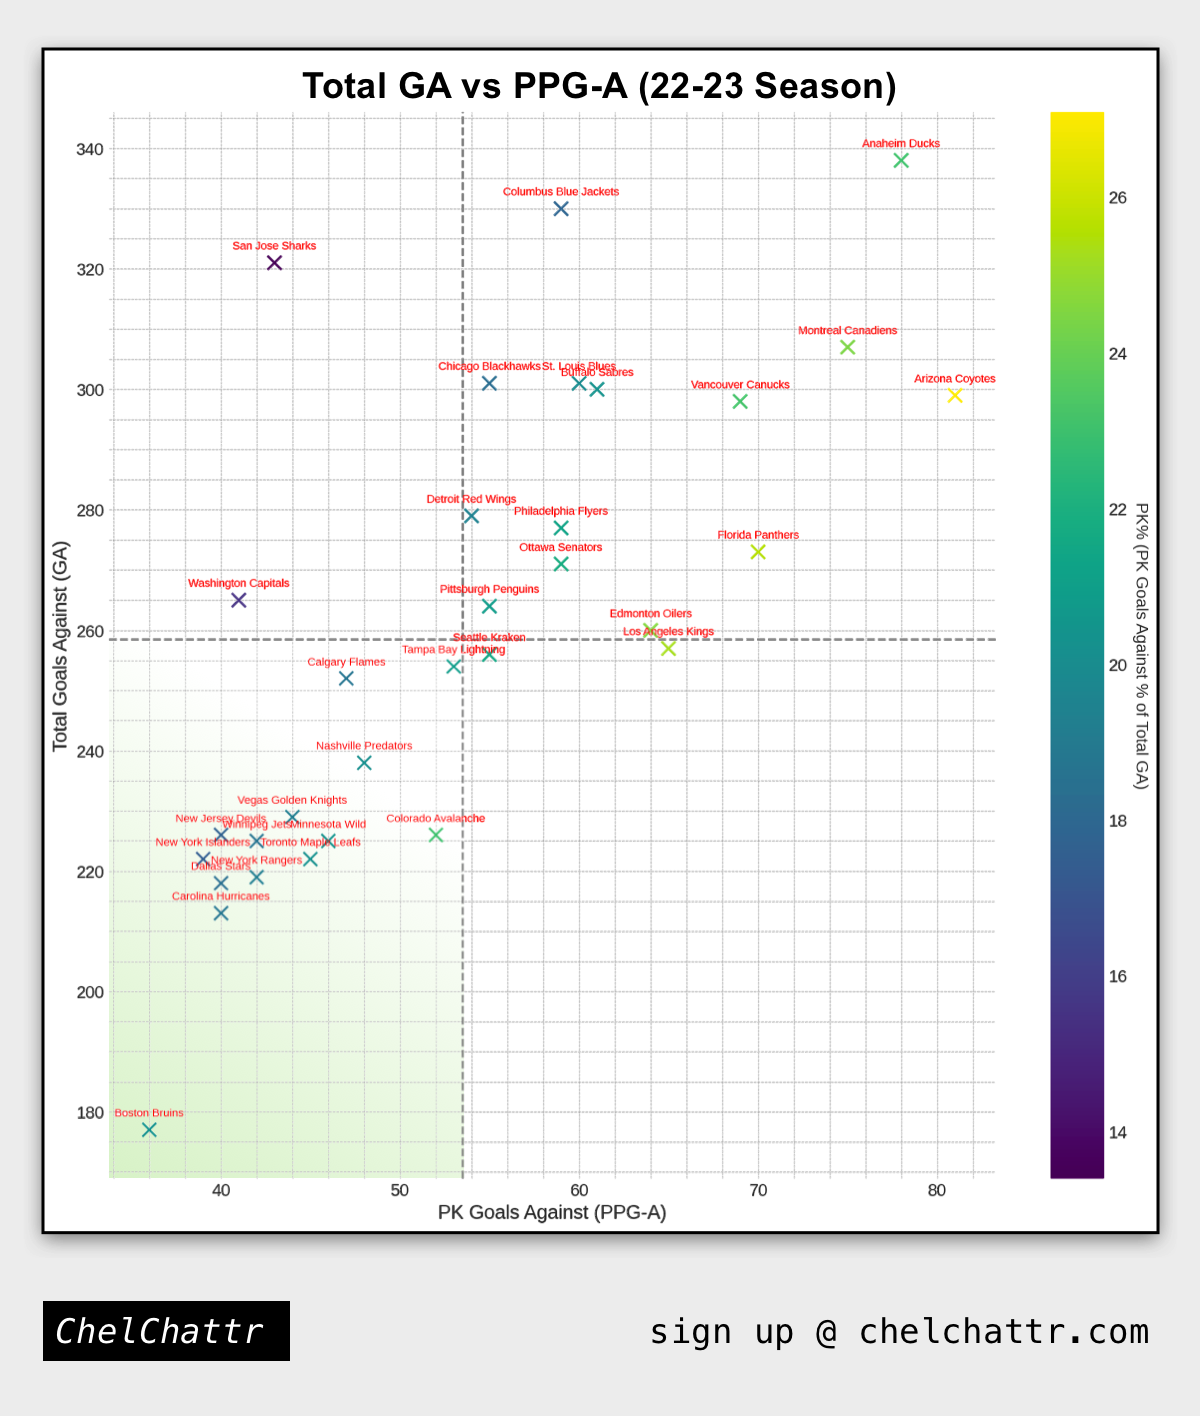
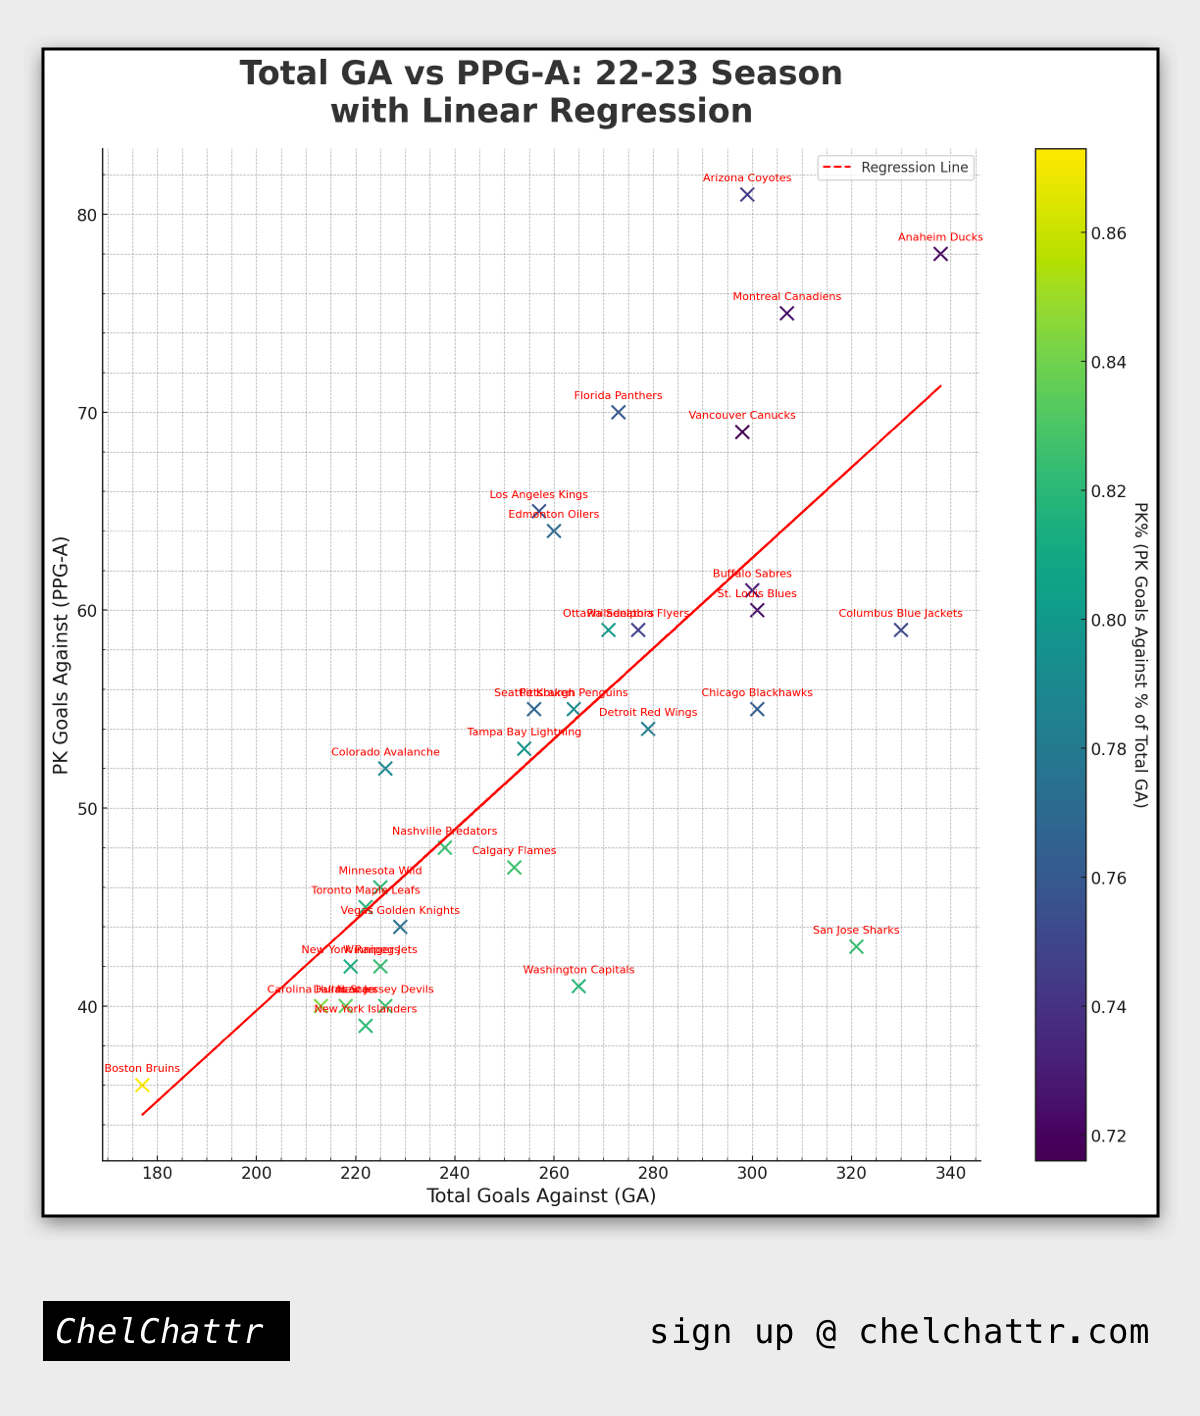
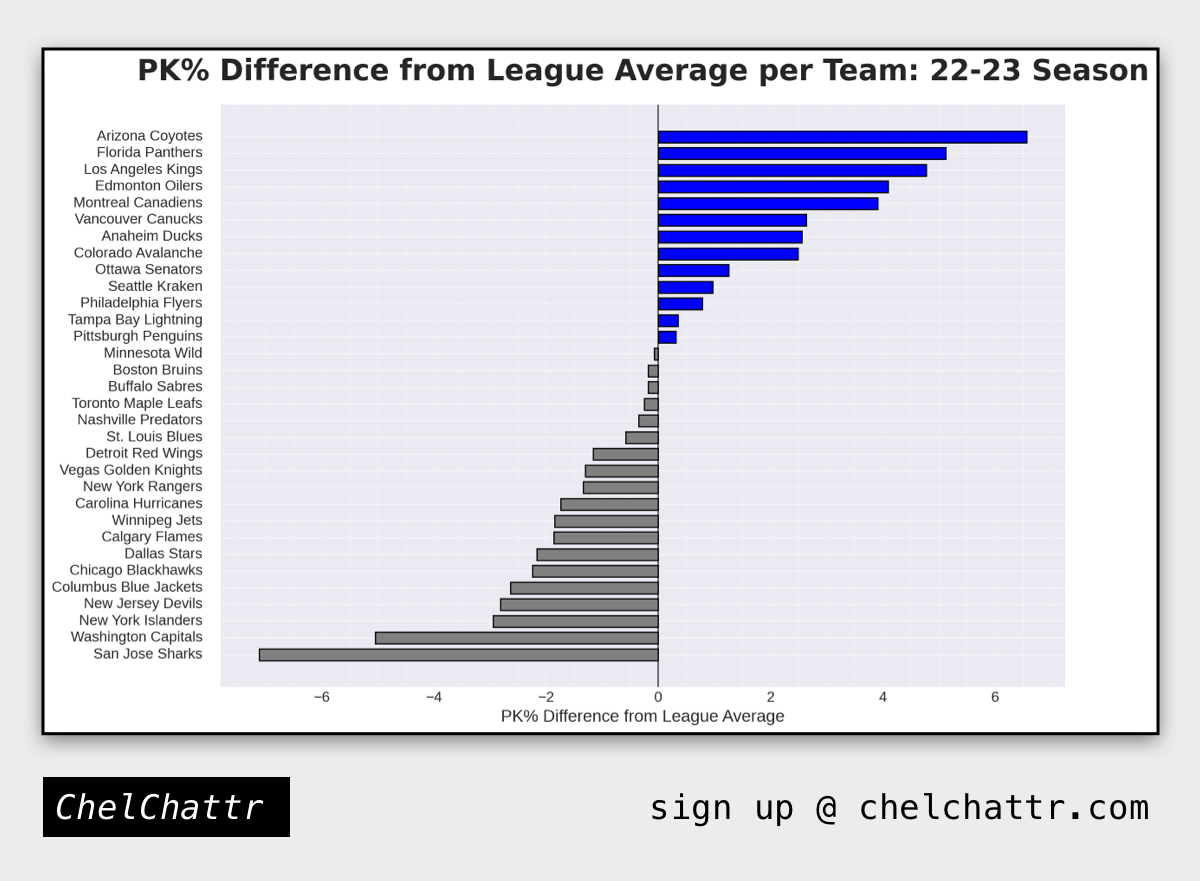
Looking at the graphs above
- Quadrant I - Upper Right: Grade Bad PK, Bad Defense
- High PPG-A, High GA
- Teams in this quadrant face challenges in both overall defense and PK, indicating a need for a comprehensive review and possibly a revamping of defensive strategies and tactics.
- Quadrant II - Upper Left – Bad Defense; Good PK
- Low PPG-A, High GA
- Teams here display a capability to defend well during penalty kills but struggle with their overall defensive play.
- Quadrant III - Lower Left: High Performing
- Low PPG-A, Low GA
- Teams in this quadrant exhibit strong overall defensive performance, both in general play and during penalty kills. These teams could serve as benchmark models for effective defensive play and penalty killing.
- The Bruins are far and away the best performing team
- Quadrant IV - Lower Right: Bad PK; Great Defense
- High PPG-A, Low GA
- Teams here manage to maintain a low total of goals against despite a high number during penalty kills, indicating effective 5v5 defense but possible issues during PKs.
Takeaways
- A majority of the teams exhibit a positive correlation between Total GA and PPG-A, suggesting that teams that allow more goals in general also tend to allow more during PKs.
- PK Efficiency Insights:
- Darker points (indicating a higher PK%) are spread across various Total GA and PPG-A values. Teams like the Seattle Kraken and Los Angeles Kings have relatively low total GA but higher PK goals against, hinting at a specific vulnerability during PKs.
- On the other hand, teams like the Winnipeg Jets and Vegas Golden Knights show darker shades, indicating that a significant proportion of their total GA occurs during PKs, even though their overall GA isn't the highest in the league.
- Team Specifics:
- Teams like the Detroit Red Wings, Columbus Blue Jackets, and Anaheim Ducks show relatively high values for both metrics, suggesting challenges in both general defensive play and penalty killing.
- Conversely, teams such as the Dallas Stars and New York Islanders maintain lower values in both aspects, indicating efficient defensive play and penalty killing.
- Anomalies & Outliers:
- Certain teams, like the Seattle Kraken, exhibit relatively low total GA but have a higher PPG-A, suggesting a specific area (PK) that could be optimized to further enhance their defensive performance.
Linear Regression – and Graphing the Residuals
A positive residual indicates that the actual PPG-A is higher than what would be predicted by the regression line (given the total GA), while a negative residual indicates that the actual PPG-A is lower than the predicted value.
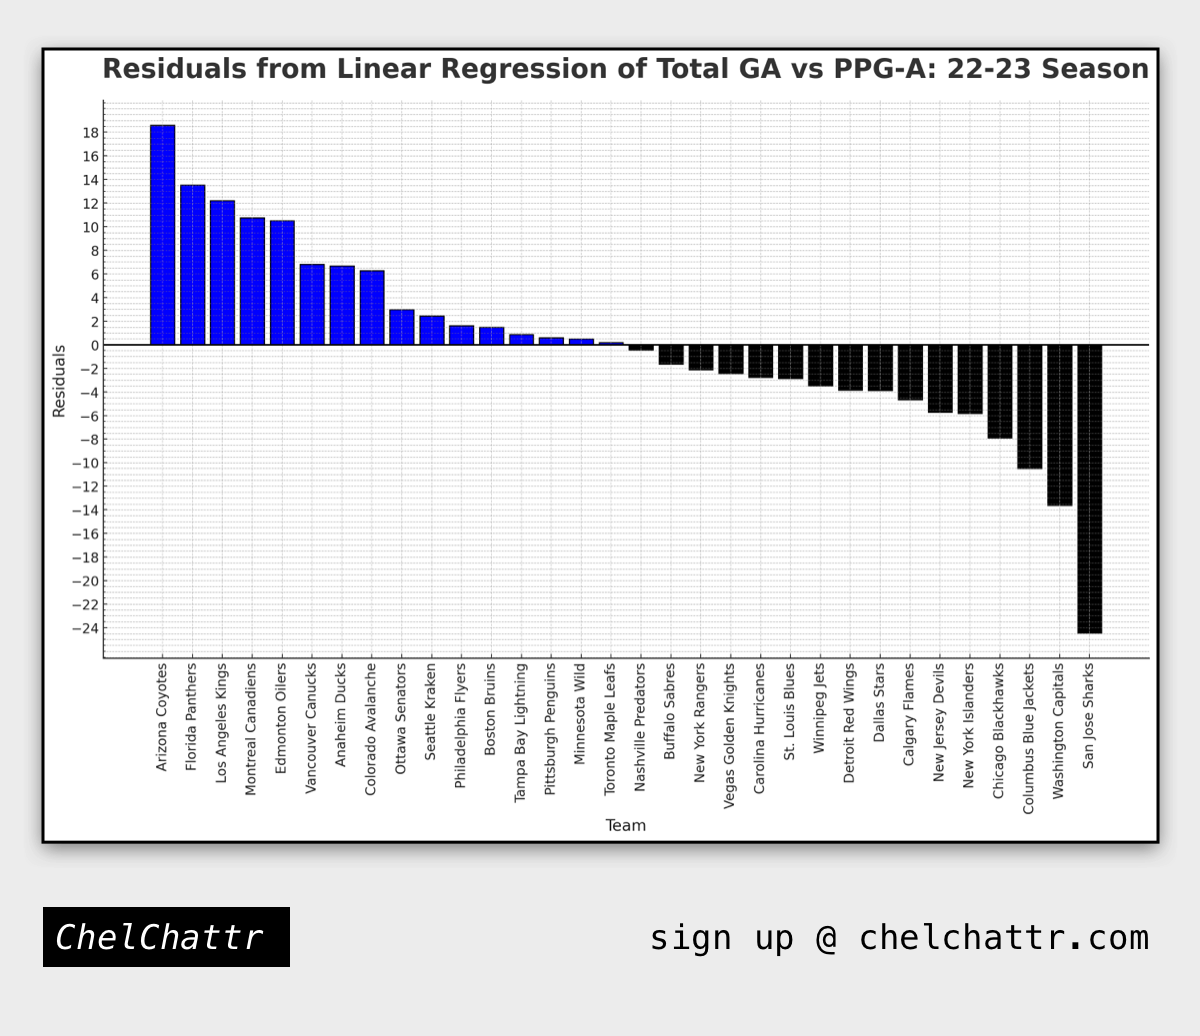
- Teams that are particularlybad on the PK
- Teams like the Arizona Coyotes, Florida Panthers, and Montreal Canadiens have significantly higher PPG-A than predicted, indicating potential specific weaknesses or challenges during PKs that might not be reflected in their overall defensive performance.
- High-Performing Teams
- Conversely, teams like the San Jose Sharks and Washington Capitals have much lower PPG-A than predicted, which could mean their PK performance is relatively strong compared to their overall defensive play.
- Outliers
- The San Jose Sharks stand out with a significantly negative residual, suggesting a notably strong PK performance relative to their total GA, which might be a result of a strategic focus or strength in PK scenarios.
